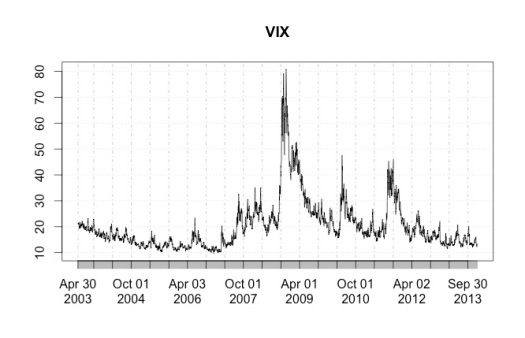
In one of my previous posts I show how simple averaging of opinions of analysts about future stock returns could significantly improve their predictions of market behavior. Still, much space for errors left, and almost all of it concentrated around market crashes. The latter is hard to predict, although there are some interesting approaches. Today I’ll use The CBOE Volatility Index (VIX®) to predict analyst error itself.
VIX measures average implied volatility of options on S&P500 index, traded on CBOE – one of the most liquid exchange traded derivative in the world. Implied volatility is obtained when option pricing equation (say, Black-Sholes) is solved for volatility term (variance), assuming observed option premium (i.e. option price) is “fair”. Investopedia calls VIX “investor fear gauge”, and there’s a reason for that: indeed, VIX starts to rise when uncertainty is high and traders are buying options to hedge positions, which keeps option premiums high, all else being equal. You can see from the above how VIX starts to rise exactly before crisis and drops sharply exactly before it ends. Daily VIX quotations could be downloaded from Yahoo Finance directly to R using quantmod package. Data on aggregated analyst errors could be donwnloaded here: SPX.mean.errors.Rdata (don’t forget to change file extension to .Rdata after downloading).
load("SPX.mean.errors.Rdata")
library(quantmod)

getSymbols('^VIX', from = '2003-04-30', to = '2013-12-31')
plot(VIX) # download VIX from Yahoo Finance and plot it
# convert daily VIX to monthly
# and make dataset of changes in VIX and errors
VIX.m <- to.monthly(VIX)$'VIX.Close'
colnames(VIX.m) <- 'VIX'
dataset <- data.frame(Err = diff(mean.errors)['2003-06-01::'],
                      VIX = diff(VIX.m)['2003-06-01::'])

# estimate simple linear model
VIX.model <- lm(Err ~ Lag(VIX, 1), data = dataset)
summary(VIX.model)
par(mfrow = c(2, 2))
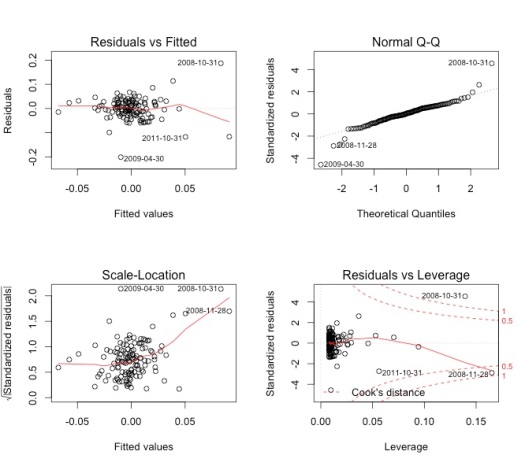
plot(VIX.model)
As you can see, VIX changes really do have some explanatory power over changes in errors, although there are some shocks in residuals. Perhaps next time I should use another explanatory variable, like, say, TED spread.


